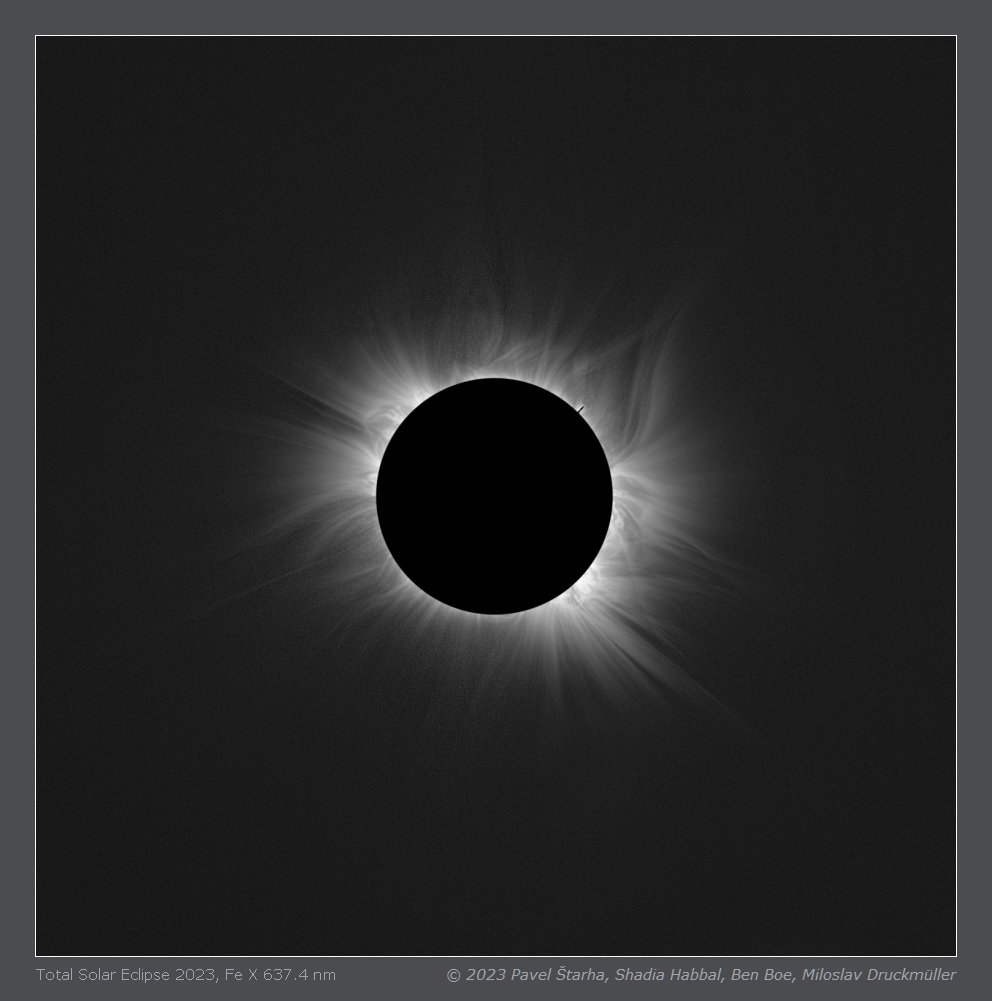
Fe X 637.4 nm
Our expedition observed emission from several ions in the visible
and near IR wavelength range. The strong emission of Fe X (637.4 nm),
Fe XI (789.2 nm) and Fe XIV (530.3 nm)
enables to create high resolution images. These emission lines provide an excellent
diagnostic tool
for probing the physics of the solar corona. One of these tools is clear from the following graph.
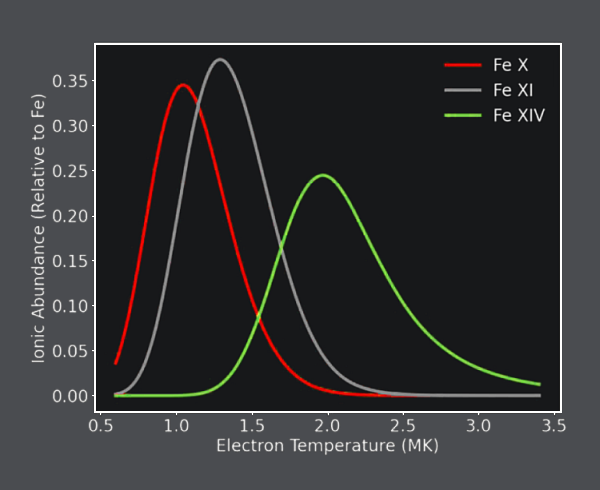 Fe X line at 637.4 nm is interesting because its image shows the "cold" part of E-corona.
Even though Fe X is a relatively strong emission line (the second strongest in the visible part of
coronal
spectrum), it is not easy to obtain an image of Fe X. It is not as simple as deep sky photography of
emission
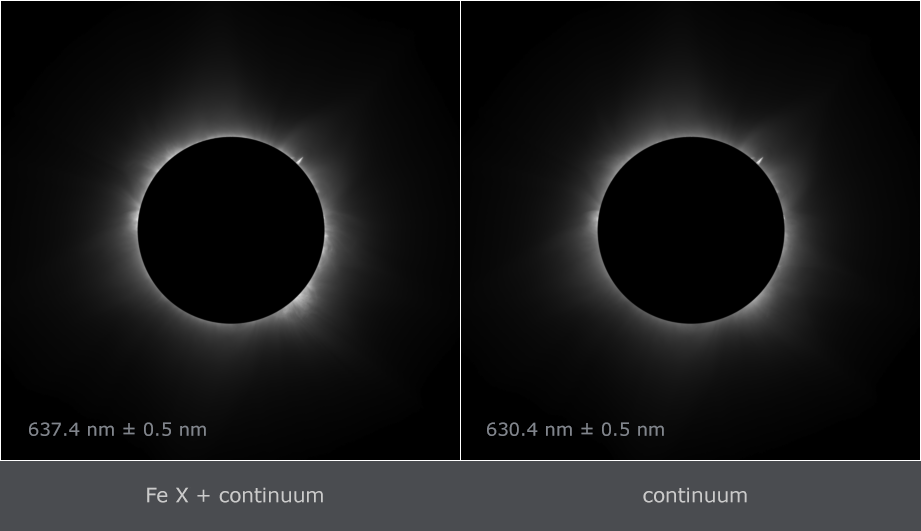
nebulae where only sufficiently narrow band filter is needed to isolate the emission line. The emission in
the
solar corona is dominated by continuum - photospheric light scattered on free electrons. The light emitted
by different atoms and ions is very weak relative to the continuum. See the following two unprocessed images.
The left one was taken through a narrow band filter (bandwidth 1 nm) with a transmission band centered on the
Fe X 637.4 nm emission line. The right image was taken through a filter with transmission band
outside the Fe X line in the continuum. It is clearly visible that the left image is highly contaminated
by continuum irradiance. It is not advisable to use a filter with a narrower band of transmission because
the emission line is thermally broadened. If the filter is too narrow, the situation becomes even worse.
Therefore it is necessary to make a precise photometric calibration of all images and then subtract the
continuum - the right image from the left one. You may see these two images as an
animation.
Fe X line at 637.4 nm is interesting because its image shows the "cold" part of E-corona.
Even though Fe X is a relatively strong emission line (the second strongest in the visible part of
coronal
spectrum), it is not easy to obtain an image of Fe X. It is not as simple as deep sky photography of
emission
nebulae where only sufficiently narrow band filter is needed to isolate the emission line. The emission in
the
solar corona is dominated by continuum - photospheric light scattered on free electrons. The light emitted
by different atoms and ions is very weak relative to the continuum. See the following two unprocessed images.
The left one was taken through a narrow band filter (bandwidth 1 nm) with a transmission band centered on the
Fe X 637.4 nm emission line. The right image was taken through a filter with transmission band
outside the Fe X line in the continuum. It is clearly visible that the left image is highly contaminated
by continuum irradiance. It is not advisable to use a filter with a narrower band of transmission because
the emission line is thermally broadened. If the filter is too narrow, the situation becomes even worse.
Therefore it is necessary to make a precise photometric calibration of all images and then subtract the
continuum - the right image from the left one. You may see these two images as an
animation.
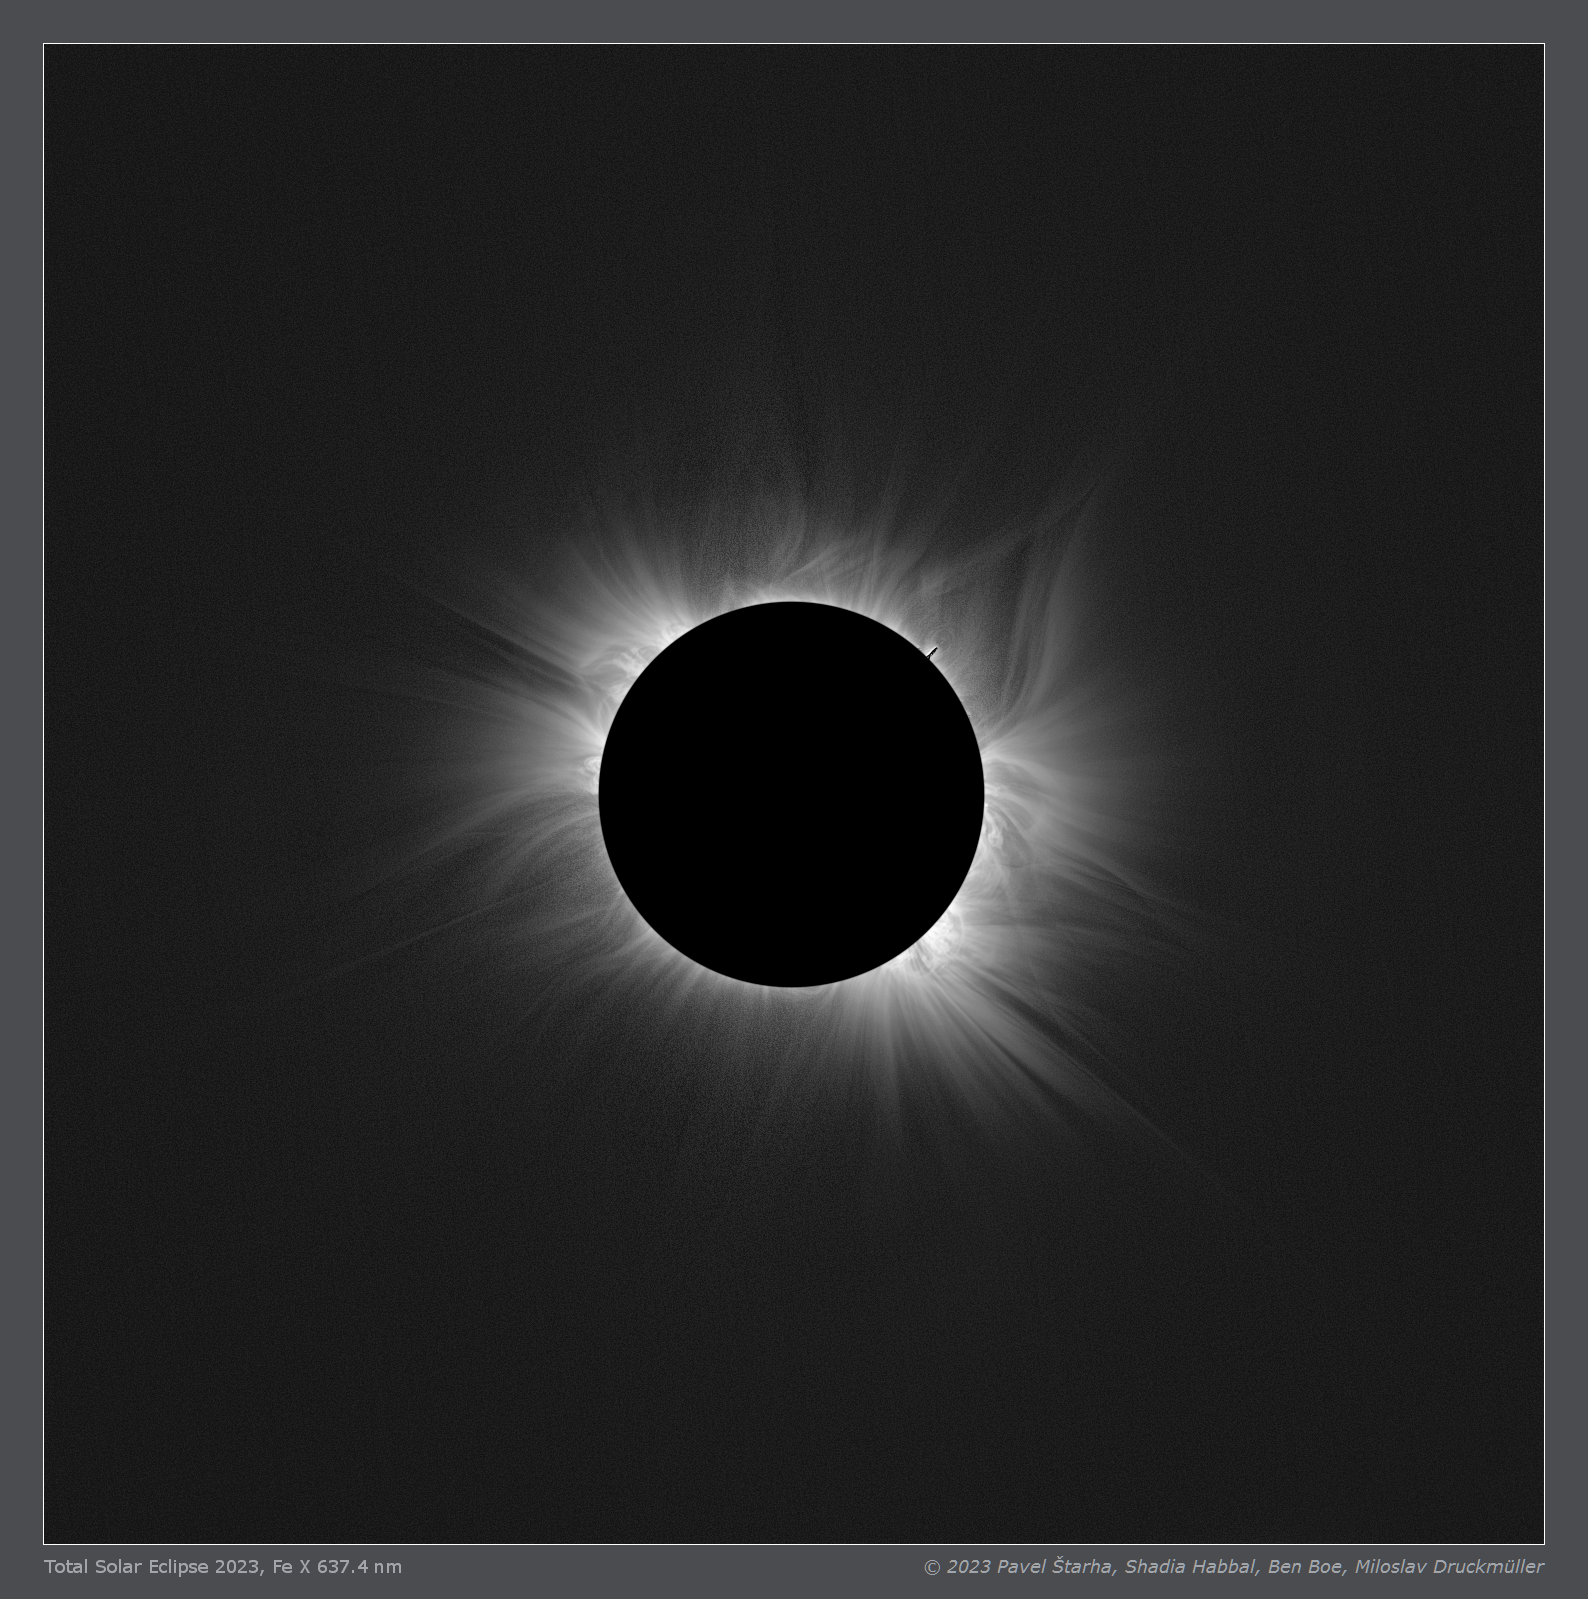
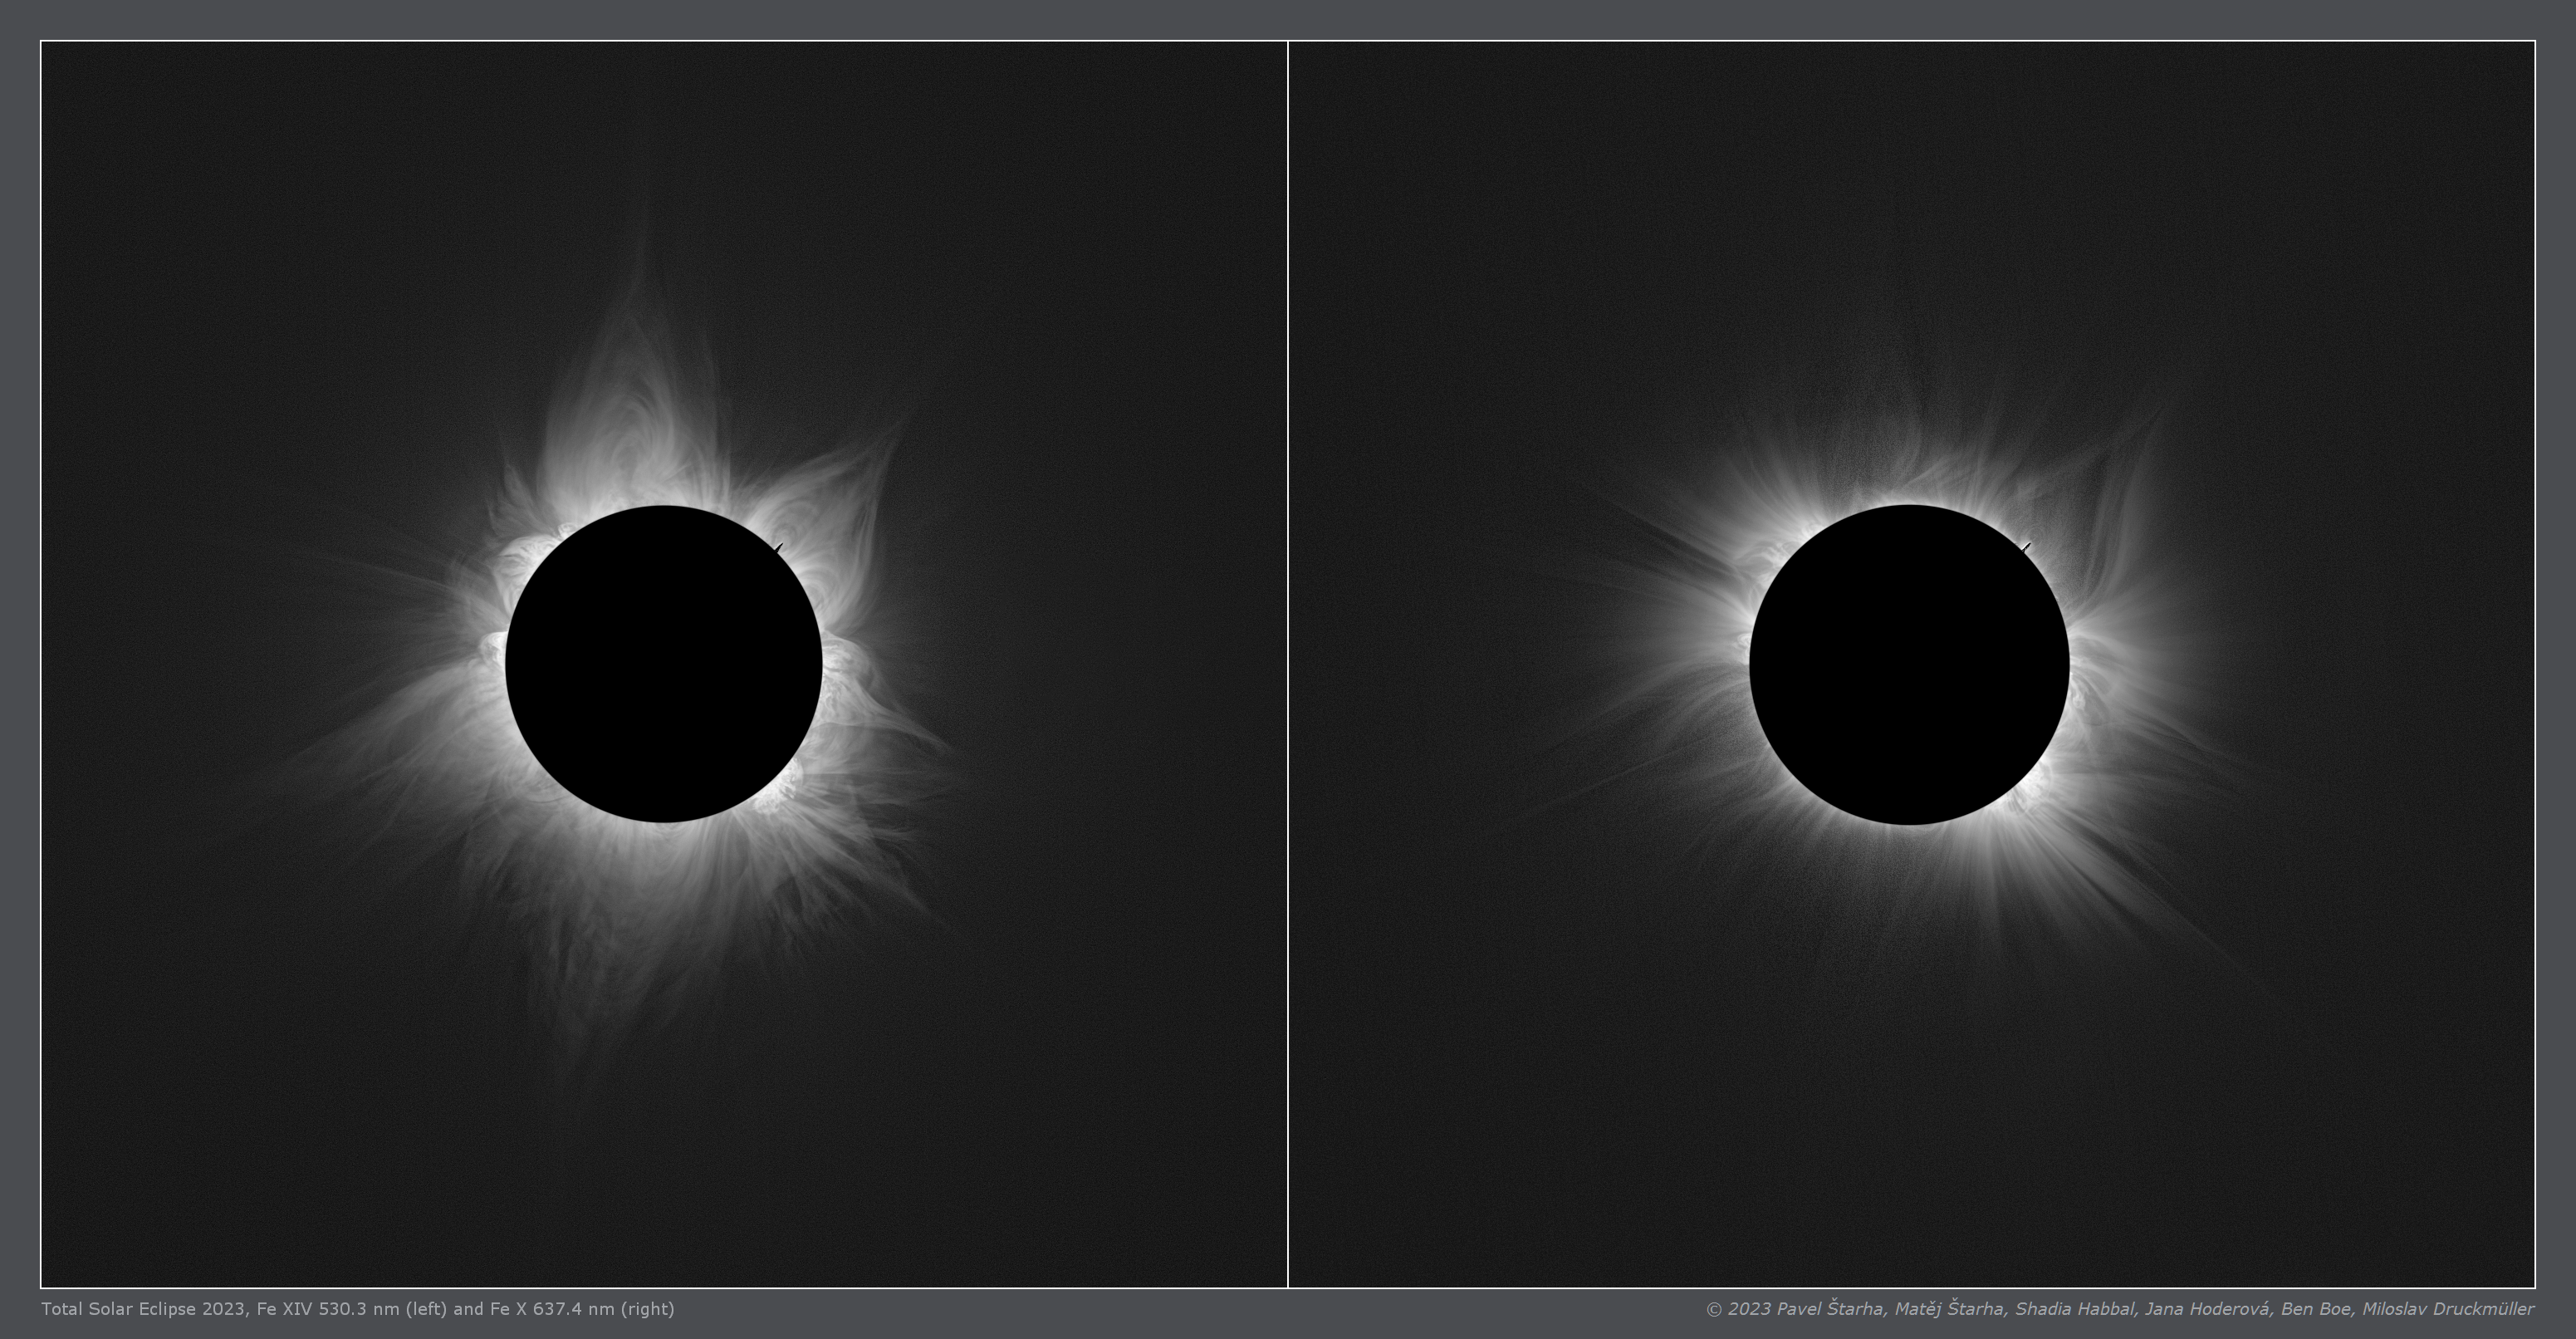
 Very interesting is the comparison of Fe X image and
Fe XIV image which shows a significant difference between the distribution of these ions in the solar
corona. Whereas Fe XIV ions visualize predominantly the solar magnetic field lines which are closed in
the nearest vicinity of the Sun, Fe X conversely visualizes mainly the magnetic field lines which are
opened to interplanetary space and they are closed somewhere very far from the Sun.
Very interesting is the comparison of Fe X image and
Fe XIV image which shows a significant difference between the distribution of these ions in the solar
corona. Whereas Fe XIV ions visualize predominantly the solar magnetic field lines which are closed in
the nearest vicinity of the Sun, Fe X conversely visualizes mainly the magnetic field lines which are
opened to interplanetary space and they are closed somewhere very far from the Sun.
Click on the image or on the following reference to display the
higher resolution image version (1.9 MB, PNG format).
|
| Image | TSE_2023_FE_X_Exmoth.png |
| Date | 20. 04. 2023 |
| Time | 2nd contact 03:29:49 UT, 3rd contact 03:30:46 UT |
| Place | Exmouth, Australia |
| Coordinate | S 21° 55.842', E 114° 7.6002', Alt. 15 m |
| Conditions | Clear sky, solar altitude 54.3° above horizon |
| Optics | 2× Zeiss Tele-Tessar 4/300 mm equipped with following narrow band filters:
on-band filter: Alluxa, center wavelength 637.4 nm, bandwidth 1 nm
off-band filter: Alluxa, center wavelength 630.4 nm, bandwidth 1 nm |
| Camera | 2× ZWO ASI1600MM Pro |
| Exposure | 0.025 s - 3.2 s |
| Processing | Composition of 74 eclipse images (37 on-band and 37 off-band) taken with two cameras. Images were calibrated by means of dark frames and flat-fields, aligned by means of phase correlation, composed by means of LDIC 6.0 software, continuum was removed from Fe X emission by subtracting the off-band images. The resulting image was processed using Corona 5.0 software in order to visualize coronal structures. The final processing was done using ACC 6.1 software.
Image processing by Miloslav Druckmüller |
| Software | Astro D3F 2.0, PhaseCorr 7.0, LDIC 6.0, Corona 5.0, Sofo ACC 6.1 |
| Orientation | Image must be rotated 23.3° counter-clockwise to achieve standard orientation i.e. solar North up. |
| Copyright | © 2023 Pavel Štarha, Shadia Habbal, Ben Boe, Miloslav Druckmüller |

|
Miloslav Druckmüller
Institute of Mathematics, Faculty of Mechanical Engineering
Brno University of Technology, Czech Republic
druckmuller@fme.vutbr.cz
|
Page last update: 4.7.2023
|
|