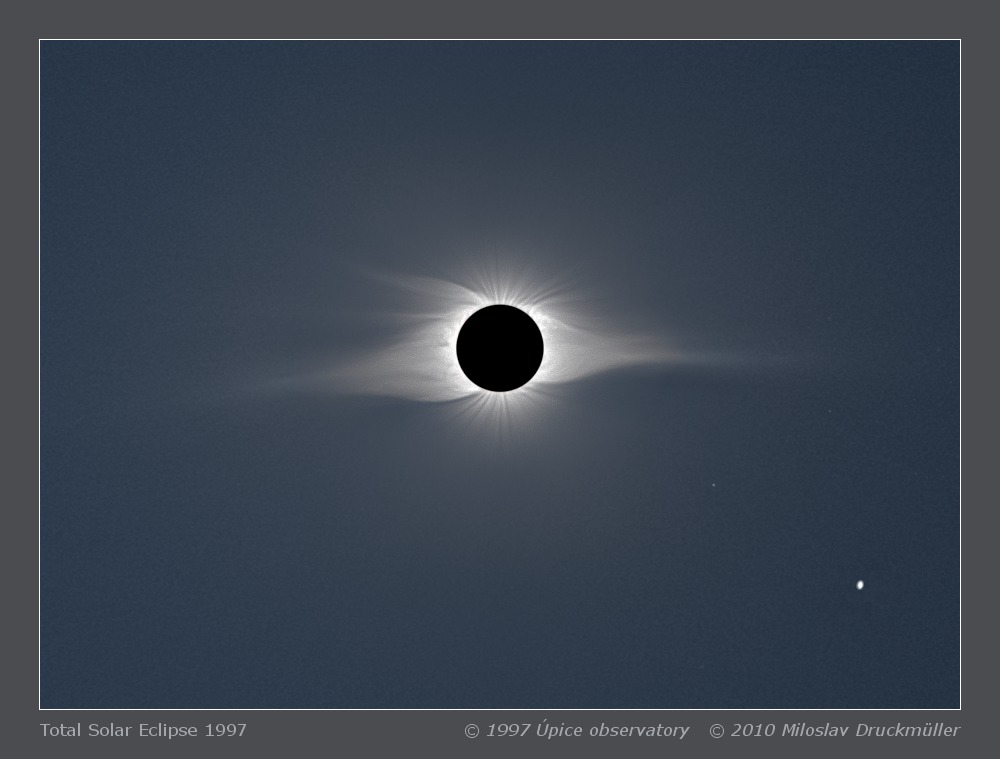
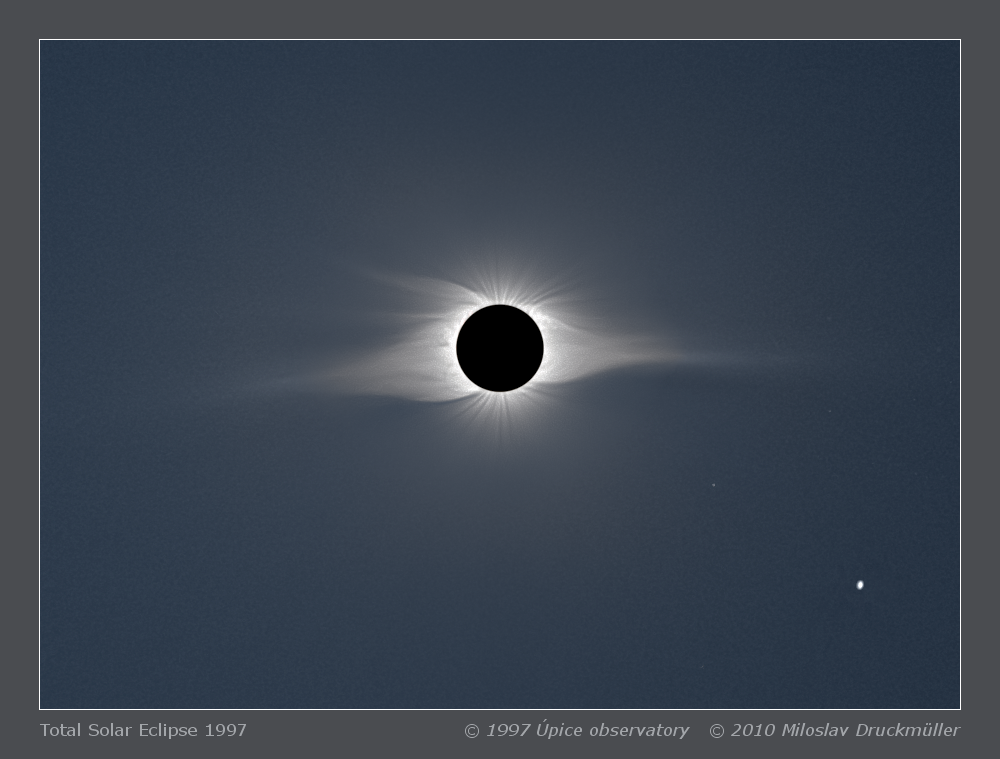
| Image | Tse1997uw1.jpg |
| Date | 09. 03. 1997 |
| Time | 2nd contact 01:08:33 UT, 3th contact 01:11:19 UT
Total eclipse duration 2min 46s |
| Place | Yerofei Pavlovich, Siberia, Russia |
| Coordinate | E 121° 56.99', N 53° 57.23', Alt. 487 m |
| Conditions | Excellent, clear sky, temperature -30°C, Sun altitude above horizon 21° |
| Optics | 4/105 mm lens and Rubinar 8/500 mm |
| Camera | Praktica |
| Film | Kodak Ektachrome 100 SW, 24×36mm |
| Processing | Composition of 13 images taken with 4/105 mm lens and 8 images taken with 8/500 mm Rubinar. Images were aligned (partially by means of phase correlation and partially using centroids of Mercury and Venus) then processed using Corona 4.1 software. Final processing done in ACC 6.1.
Image processing by Miloslav Druckmüller |
| Scanner | Nikon Super Coolscan 4000 ED (16x multisample) |
| Software | PhaseCorr 6.0, Corona 4.1, Sofo ACC 6.1 |
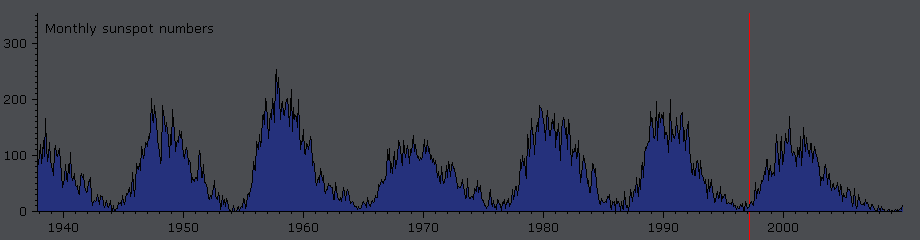
| Note | The data from the World Data Center for the sunspot index, (Solar Influences Data Analysis Center, the Royal Observatory of Belgium) were used for graph creation. |
| Orientation | The image must be rotated 3.4° clockwise to achieve the standard orientation i.e. North top, East left |
| Copyright | ©1997 Úpice observatory © 2010 Miloslav Druckmüller |