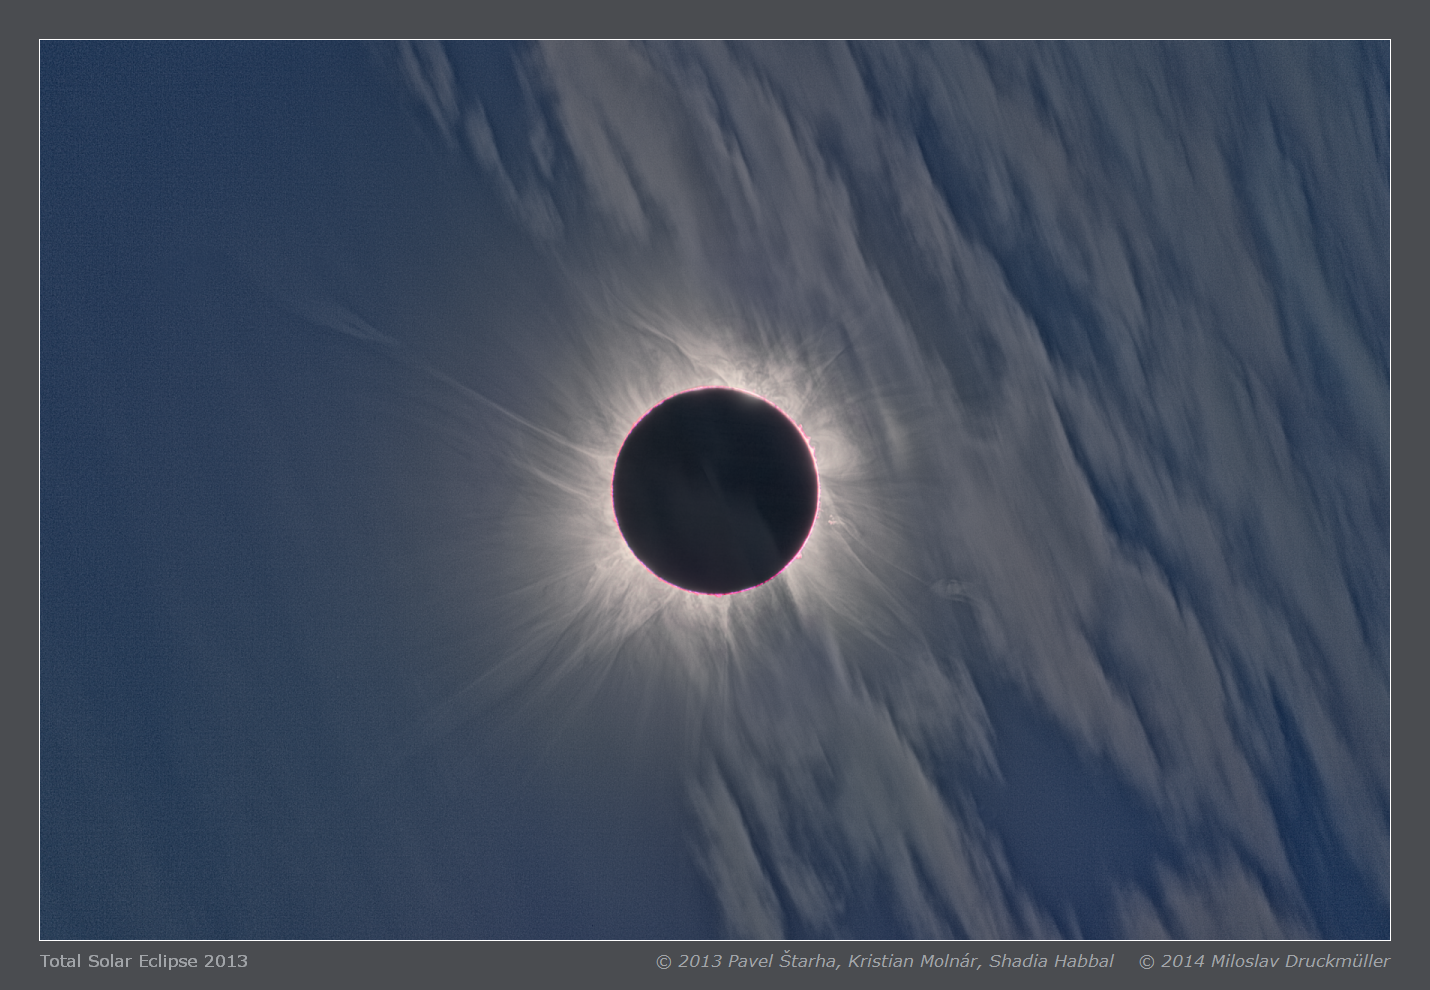
Solar corona through clouds
This image has no precedent in MMV-project archive. I have never processed total solar eclipse images
significantly influenced by clouds. There were two reasons for that. The first one was that I was
convinced that it makes no sense because no fine coronal structures would be visible. The second one
was misgiving that I am able to create a software which would align and compose correctly images
with different exposures containing moving clouds. Finally I tried to process the images even though
the solar corona was partially obscured by clouds because no other images were available from Kenya
and I knew that the relatively clear part of the image contains very interesting CME which is
only partially visible in image from Uganda.
Image processing was very complicated however the result surprised and amazed me - especially the
visibility of very intricate coronal structures through rolling clouds. Moreover the image has some
sort of beauty.
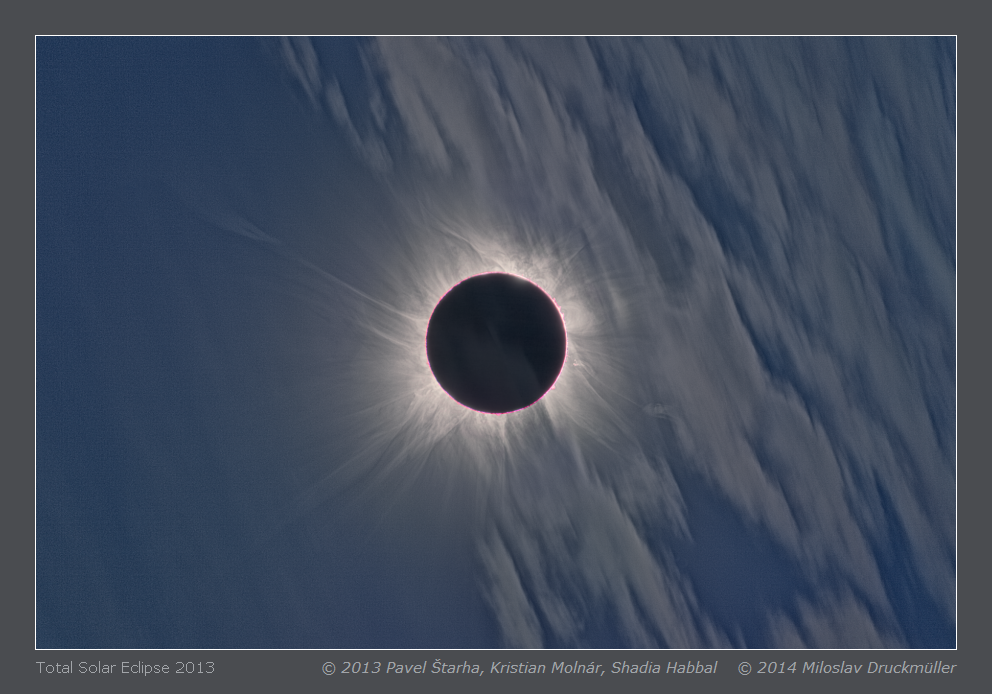
Click on the image or on the following reference to display the
higher resolution image version (1.4 MB, PNG format).
|
| Image | Tse_2013_smh.png |
| Date | 3. 11. 2013 |
| Time | 2nd contact 14:24:46 UT, Total eclipse duration 10 s (measured) |
| Place | Kenya |
| Coordinate | N 3° 29' 42.07", E 35° 26' 46.72", Alt. 565 m |
| Conditions | partially cloudy |
| Optics | (1) MTO 10/1000 mm
(2) 3M-5CA 8/500 mm
(3) 3M-65CA 6.3/500 mm |
| Camera | (1,2,3) Canon EOS 5D Mark II (ISO 100) |
| Exposure | (1) 1/250 s, 1/60 s,1/15 s
(2) 1/45 s, 1/15 s, 1/6 s
(3) 1/4 s, 1/1.4 s, 2 s |
| Processing | Composition of 49 eclipse images - 23 images (1), 20 images (2), 6 images (3). Eclipse images were calibrated by means of large number of dark frames and flat-fields, aligned by means of phase correlation, composed by means of LDIC 5.0 software, processed using Corona 4.1 in order to visualize coronal structures. Final processing was done using ACC 6.1 software.
Image processing by Miloslav Druckmüller |
| Software | Astro D3F 2.0, PhaseCorr 6.0, LDIC 6.0, Corona 4.1, Sofo ACC 6.1 |
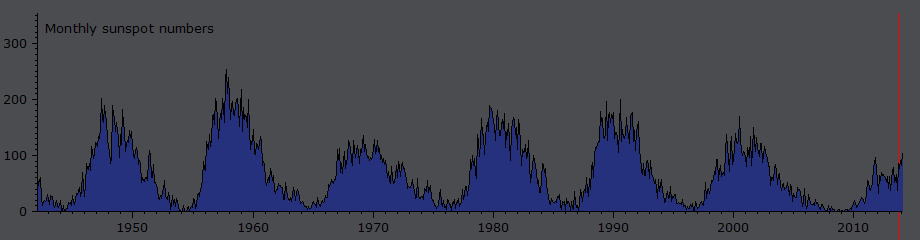
| Note | The graph above the table shows the average values of the relative number of sunspots in which the red line indicates the time of 2013 eclipse. Data from the World Data Center for the sunspot index, (Solar Influences Data Analysis Center, the Royal Observatory of Belgium) were used. |
| Orientation | Image must be rotated 131° counter-clockwise to achieve standard orientation i. e. solar North up. |
| Copyright | © 2013 Pavel Štarha, Kristián Molnár, Shadia Habbal © 2014 Miloslav Druckmüller |

|
Miloslav Druckmüller
Institute of Mathematics, Faculty of Mechanical Engineering
Brno University of Technology, Czech Republic
druckmuller@fme.vutbr.cz
|
Page last update: 27.11.2019
|
|