PM-NAFE algorithm
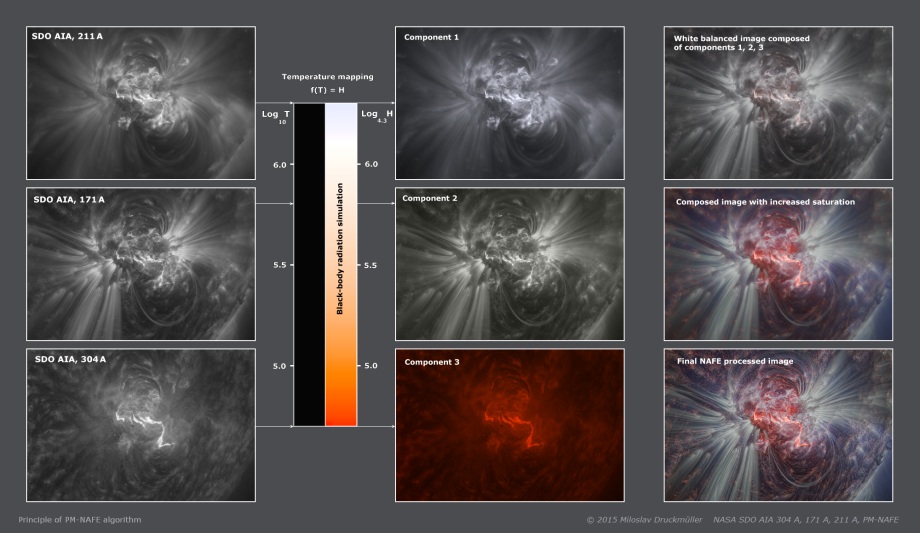
It is common to make a link between SDO AIA spectral bands and the so-called characteristic temperature. A characteristic temperature T is derived from the thermal response functions of the SDO AIA spectral bands. However, it has no precise definition. In principle, it may by the modulus (maximum), mean value (average), median or any other characteristic of position if we consider the thermal response function to be a probability density function of temperature as a variable. Because the thermal response functions for SDO AIA bands have complicated shapes, none of the existing numerical characteristics are fully suitable for representing the response curve. However, we may divide the AIA bands into two groups. Group I: 94, 131, 193 and 335 angstrom bands. All these bands are significantly multi-thermal i.e. their thermal response functions have two or more significant local maxima. Therefore, it is not possible to properly or accurately define the characteristic temperature, which would characterize these bands. These bands are not suitable for PM algorithm because the colors of the resulting image would be highly dependent on the coronal state. The meaning of the colors would be significantly different for the quiet corona, the active corona or a flare. This property was experimentally tested. Group II: 211, 171 and 304 angstrom bands. These three bands have thermal response functions with only one significant maximum. In this case it is possible do define meaningful values for the characteristic temperature T for these bands. Hence, these bands are suitable for PM algorithm. Now we must define a link between temperature and color which is meaningfull for human vision. It may be done by simulating black-body radiation. However characteristic temperatures of SDO AIA bands are very high and the radiation maximum of the black-body with corresponding temperature is mainly within the EUV range. Therefore, it is necessary to define the mapping of the characteristic temperature T to a lower temperature H by which the black-body radiates visible light and for which the human vision has experience with perceiving corresponding colors and understanding the corresponding temperatures. The mapping is defined by the formula log T = log a H, where a=4.3 was chosen. This means that T and H have the same logarithm but with a different base. The base a=4.3 was chosen in order to shift the black-body radiation corresponding to the 304 A band near to the lower end of visibility for human vision (850 K). Using this mapping gives for 211, 171 and 304 angstrom bands color images with very subtle colors. In order to obtain vivid colors it is necessary to increase significantly the color saturation of the image. This step must be accomplished by precise color balancing. Otherwise, the final image would contain only one dominant color. The algorithm for color balancing is similar to the one used in digital cameras in automatic white-balance mode.

|
