Inner Corona Structure (version 1)
|
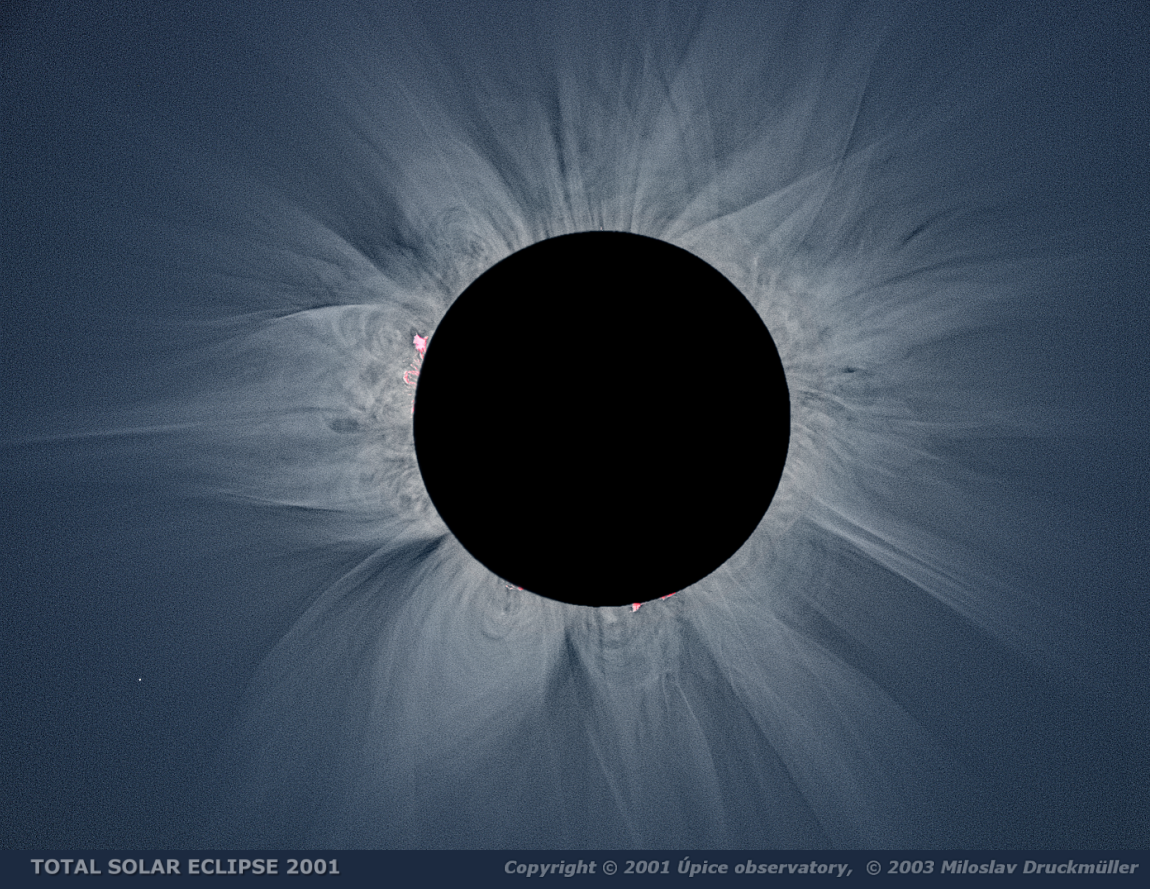
This image of the solar corona during the 2001 total eclipse is the processed composite of eight
images with various exposition times. The resulting image has 1.6 MB in
PNG format but the input data set is of about 4 GB. Each
input image is of 8900 × 8900 pixels resolution and 48 bits per pixel dynamic range. The
first step of the image processing was rotation of images in order to compensate errors caused by
scanning and possible errors in tracking during eclipse. The angle of rotation was measured by means
of special program (PhaseCorr 2.0) created by author of this Web pages specially for this purpose.
The program uses Fourier transform and modified phase correlation technique. The second step is
translation of images. The translation vectors were found by Sofo ACC 5.0 Analyzer - Match II
Module using relatively bright star 1 Geminorum (approx. 4th magnitude), which is visible in the
bottom left part of the image. This star is not visible in the images with the shortest exposures
even after special processing and therefore significant features in chromosphere and prominences were
used for translation vectors determination, too.
The precise registration of images is very important for achieving maximum image resolution. The high
resolution image presented on this page is resized to 1/6 of resolution of original scanns and the
registration is of subpixel precision i.e. the quality of presented image is not negatively
influenced by registration errors of images. After registration of images the sum of all images was
created. The sum of the images contains a lot of information which is invisible because the image has
more than 65 thousand brightness levels for each RGB component and the computer monitor is able to
display in the best case only 256 brightness levels of each color component. Even if the monitor was
able to display more brightness levels it would be useless because the human eye watching a standard
computer monitor is not able to distinguish more than about 200 brightness levels. The only way how
to visualize the invisible structures in corona image is to use mathematical tools inspired by human
vision.
A human eye is definitely not a camera measuring light intensity for each picture element. The human
eye is a differential analyzer comparing brightness of a point with that of its neighborhood. It has
an excellent ability of comparing brightness especially of near picture elements but it has no
ability of measuring the absolute brightness. The resulting image we see is the result of
sophisticated "mathematical processing" of differential measurements done by "software running in our
brain computer". The picture we see is a sort of "virtual reality" generated by our brain which is
continuously updated according to incoming measurements. Another very important feature of human
vision is adaptivity. An eye has the ability to change the focusing, sensitivity, contrast, color
calibration and many other parameters during the observation and even more - the "image processing"
may be changed according to local properties of the observed image. Mathematical methods inspired by
these properties of human vision are generally called adaptive filters. A correctly constructed
adaptive filter can modify high contrast image with high dynamic range in such a way that it can be
displayed on low contrast display like computer monitor and create an image relatively similar to
what could be observed directly by human eyes. Of course the sensation will be never identical to
reality because the human vision has the ability to estimate the contrast which is on the computer
screen significantly lower than in reality.
Presented image is processed by special program (Corona 2.0) created by the author of these Web pages
which uses so called adaptive convolution. The processing is from the mathematical point of view the
increasing the contrast on high spatial frequencies. It can be done by Fourier transform in frequency
domain or by convolution in space domain. Both these methods suffer from edge effects caused by
brightness function discontinuity on the Moon's edge. The problem can be managed by convolution with
adaptive kernel and this method is used in Corona 2.0 software.
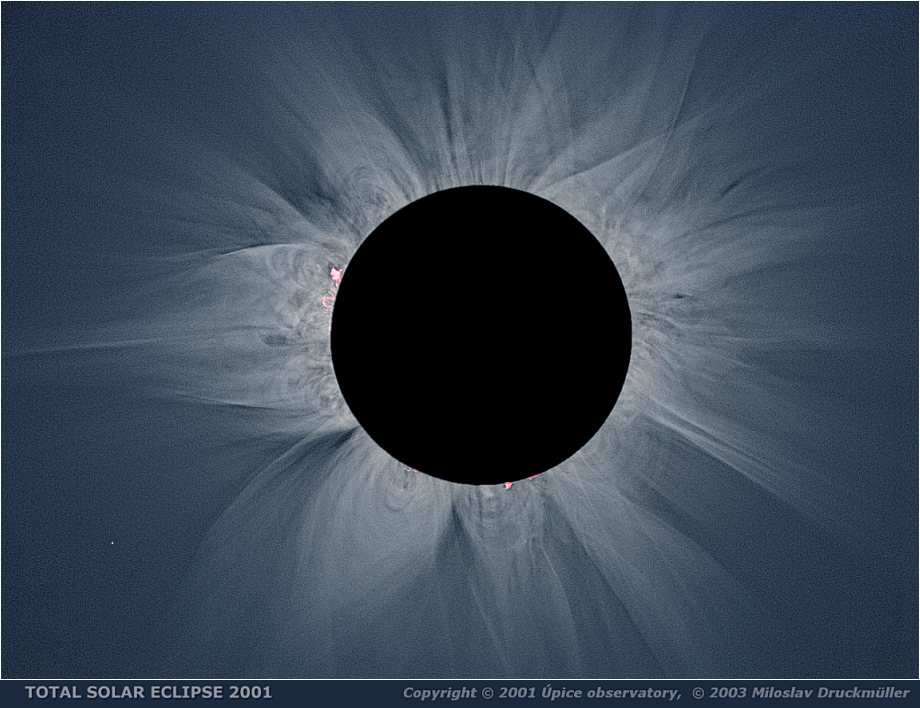
Click on the image or on the following reference to display the
higher resolution image version (1.6 MB, PNG format).
|
| Image | Se2001u_comp09-17_enh1.png |
| Date | 21. 06. 2001 |
| Time | Second contact 12:36:34 UT, third contact 12:41:10 UT
Total eclipse duration 4 min 36 s |
| Place | Angola, near Sumbe (Ngunza) |
| Coordinate | S 11° 07' 29'', E 13° 55' 51'', Alt. 168 m |
| Conditions | Excellent, clear sky |
| Optics | Mertz - II, 1875/100 mm (VOD Turnov), siderostat off-axis configuration |
| Camera | PENTAX 67 II, 6 × 7.5 cm format |
| Resolution | 5.36 arc sec / pixel - full resolution version |
| Film | Kodak Ektachrome 100 S Professional |
| Processing | Sum of 8 images enhanced by means of adaptive kernel convolution.
Image processing by Miloslav Druckmüller |
| Scanner | Nikon LS 8000 (4000dpi resolution, RGB, 3 × 16 bit/pixel) |
| Software | Sofo ACC 5.0 Scientific Image Analyzer with Match II Module (final processing)
Corona 2.0 Analyzer (coronal structure enhancement)
PhaseCorr 2.0 Analyzer (rotation estimation - registration of images) |
| Orientation | Image must be rotated -9.47° (clockwise) to achieve the standard orientation (N top, E left) |
| Copyright | © 2001 Úpice Observatory, © 2003 Miloslav Druckmüller |

|
Miloslav Druckmüller
Institute of Mathematics, Faculty of Mechanical Engineering
Brno University of Technology, Czech Republic
druckmuller@fme.vutbr.cz
|
Page last update: 27.11.2019
|
|